
Clinical trial research · Product design · Design systems · 2019 - 2020
Designing Disease Maps and a shared system for eight products
I designed Disease Maps, a clinical trial research and management product. It connected geographic exploration with physician and facility detail, then let users define cohorts through inclusion and exclusion criteria.
Alongside Disease Maps, I created a shared design system that helped two designers support eight analytics products.
Clarify Health · Lead Product Designer
Role
Lead Product Designer
Team
One of two product designers, working with product, engineering, sales, and clinical trial users
Scope
Research, maps, detail views, cohort criteria, navigation, charts, and shared components
Duration
Lead role · 2019 - 2020
Context
Clinical trial research across disconnected tools
Disease Maps was a new product opportunity, and the team needed to understand which parts of clinical trial research it should support. Across the wider portfolio, eight products used different controls, navigation, and chart libraries. Some screens took 10 to 20 seconds to load without giving users any feedback.
My role
I led research and design for Disease Maps, from early concepts through map exploration, detail views, and the cohort builder. I also created shared interface patterns for the eight-product portfolio and worked with engineering on component and chart-library consistency.
Following the research from maps to criteria
I interviewed target users about their clinical trial work, the tools they used, and the points where information had to move between them. I also reviewed competing products and tested concepts with users. That work helped define a flow from geographic exploration to detailed research and cohort criteria.
Design
Design decisions
01
Connecting exploration with cohort definition
Users needed to move from a geographic view into physician and facility details, then define the criteria for a cohort. I connected those steps through maps, detail views, tables, and a criteria builder.
I tested and revised concepts with target users as the product took shape. The resulting workflow kept the research and inclusion and exclusion rules together.
02
Using one system across eight products
The portfolio mixed Bootstrap, Material, local components, and multiple chart libraries. Similar tasks looked and behaved differently, creating repeated design and QA work.
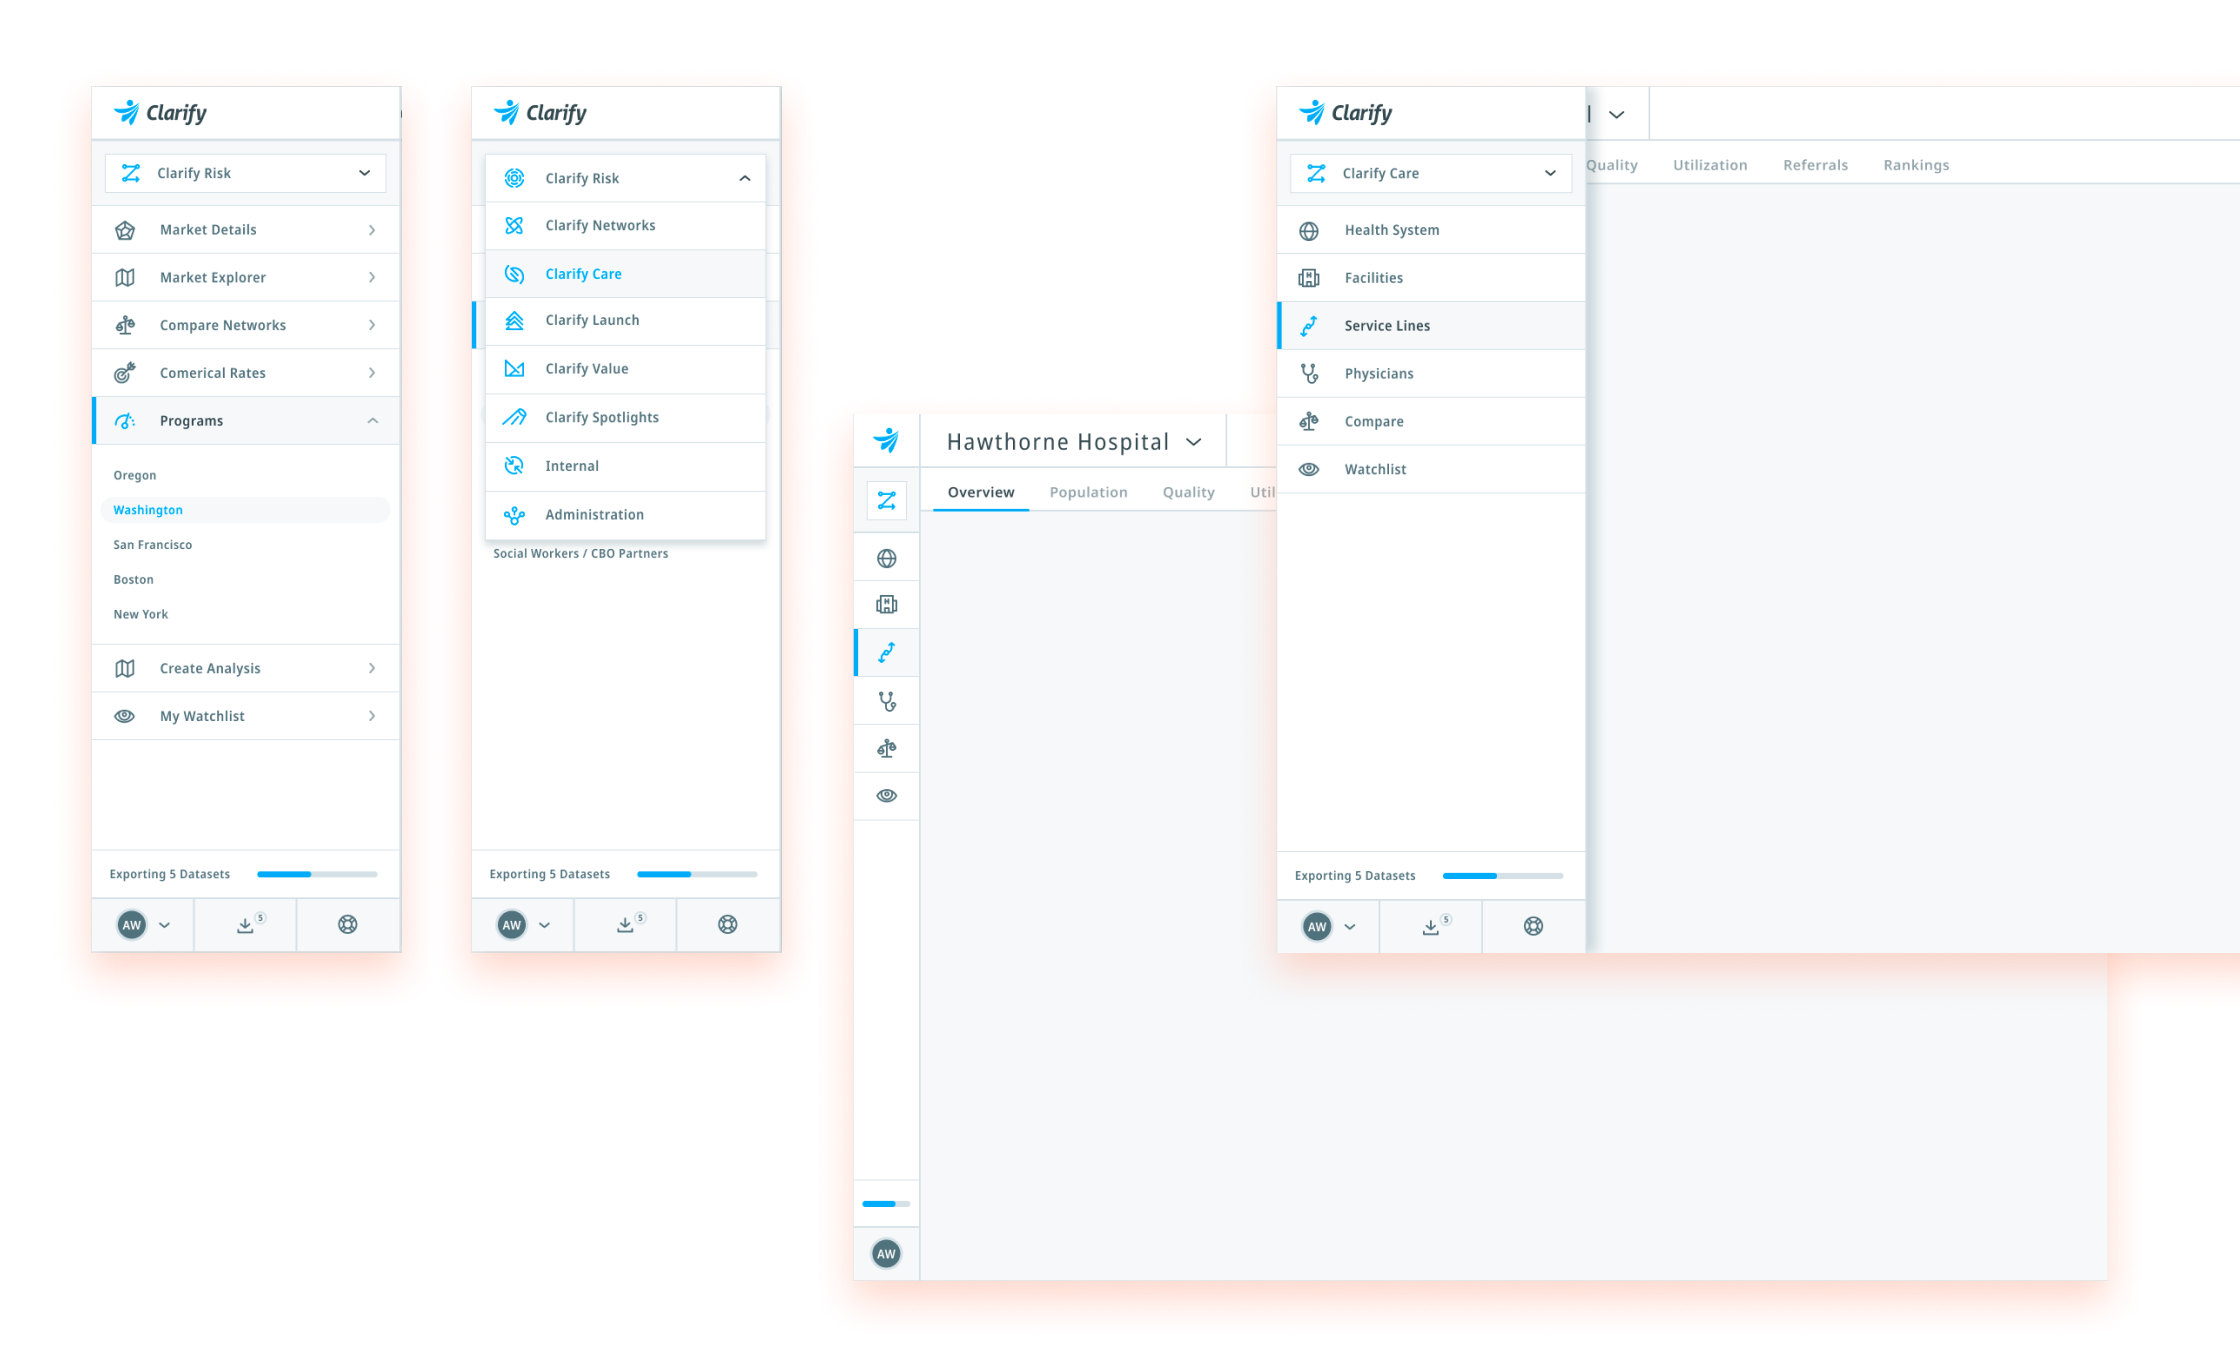
I designed shared navigation, controls, layouts, charts, and system states. Disease Maps gave us a product in which to apply the patterns while the same system supported the rest of the portfolio.
03
Giving feedback during long data loads
A screen could take 10 to 20 seconds to load without explaining what was happening. I defined loading, empty, success, warning, and failure states for the data-heavy workflows.
These states gave users feedback while engineering continued work on performance. They addressed the experience of waiting; they did not make the underlying query faster.
A closer look
Product screens
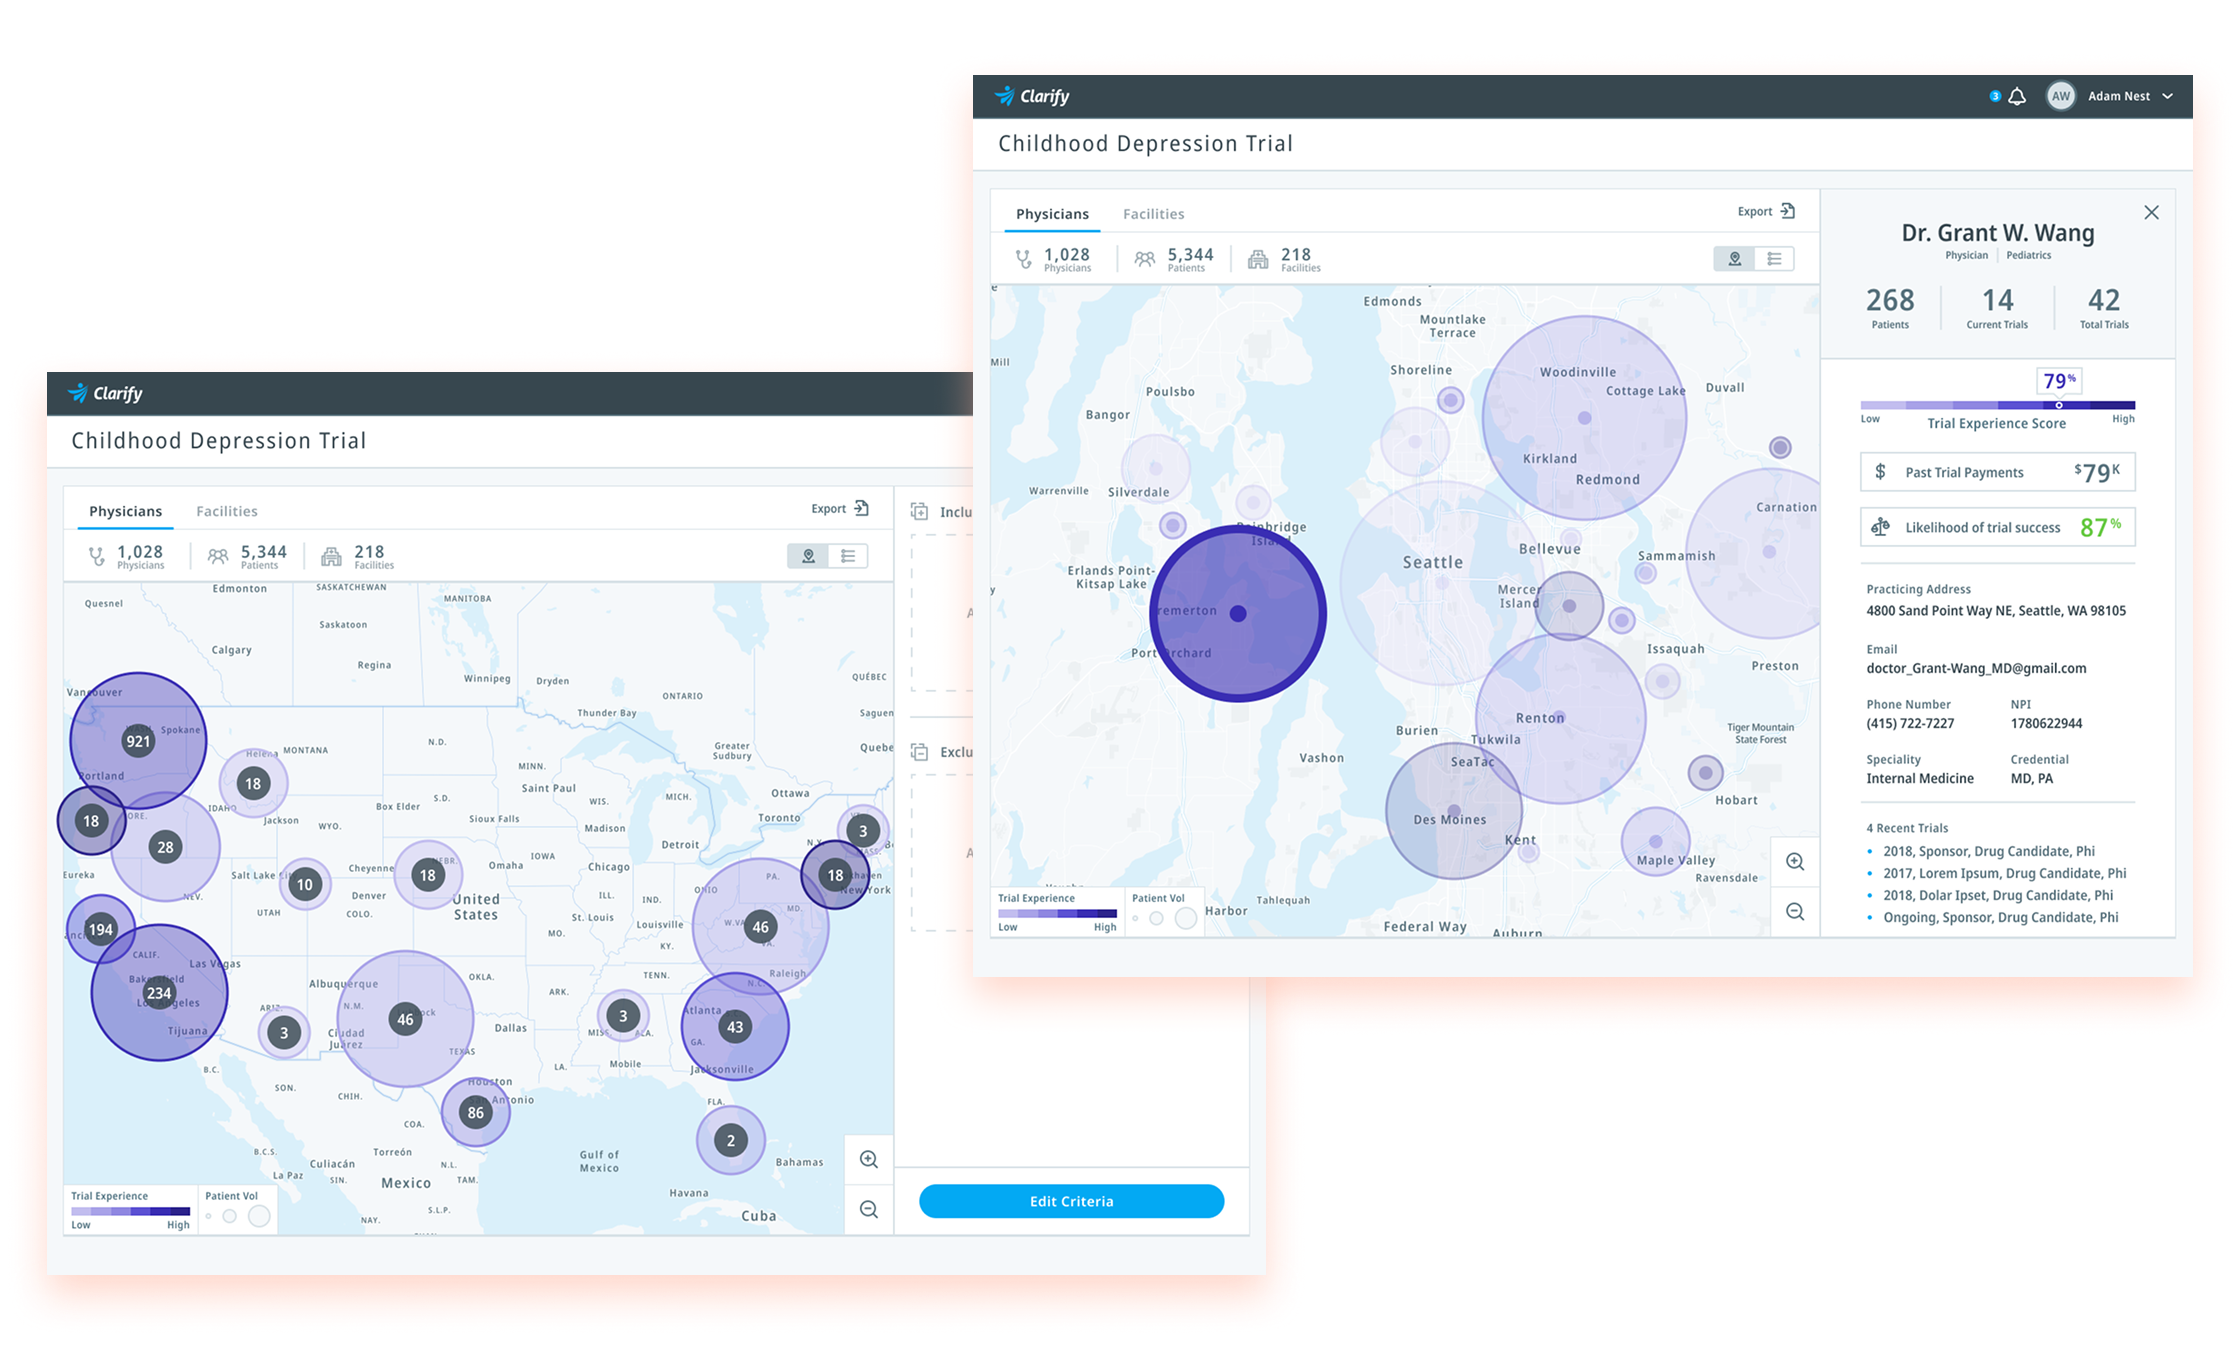
Users can move from a national map to regional detail and physician information during trial research.
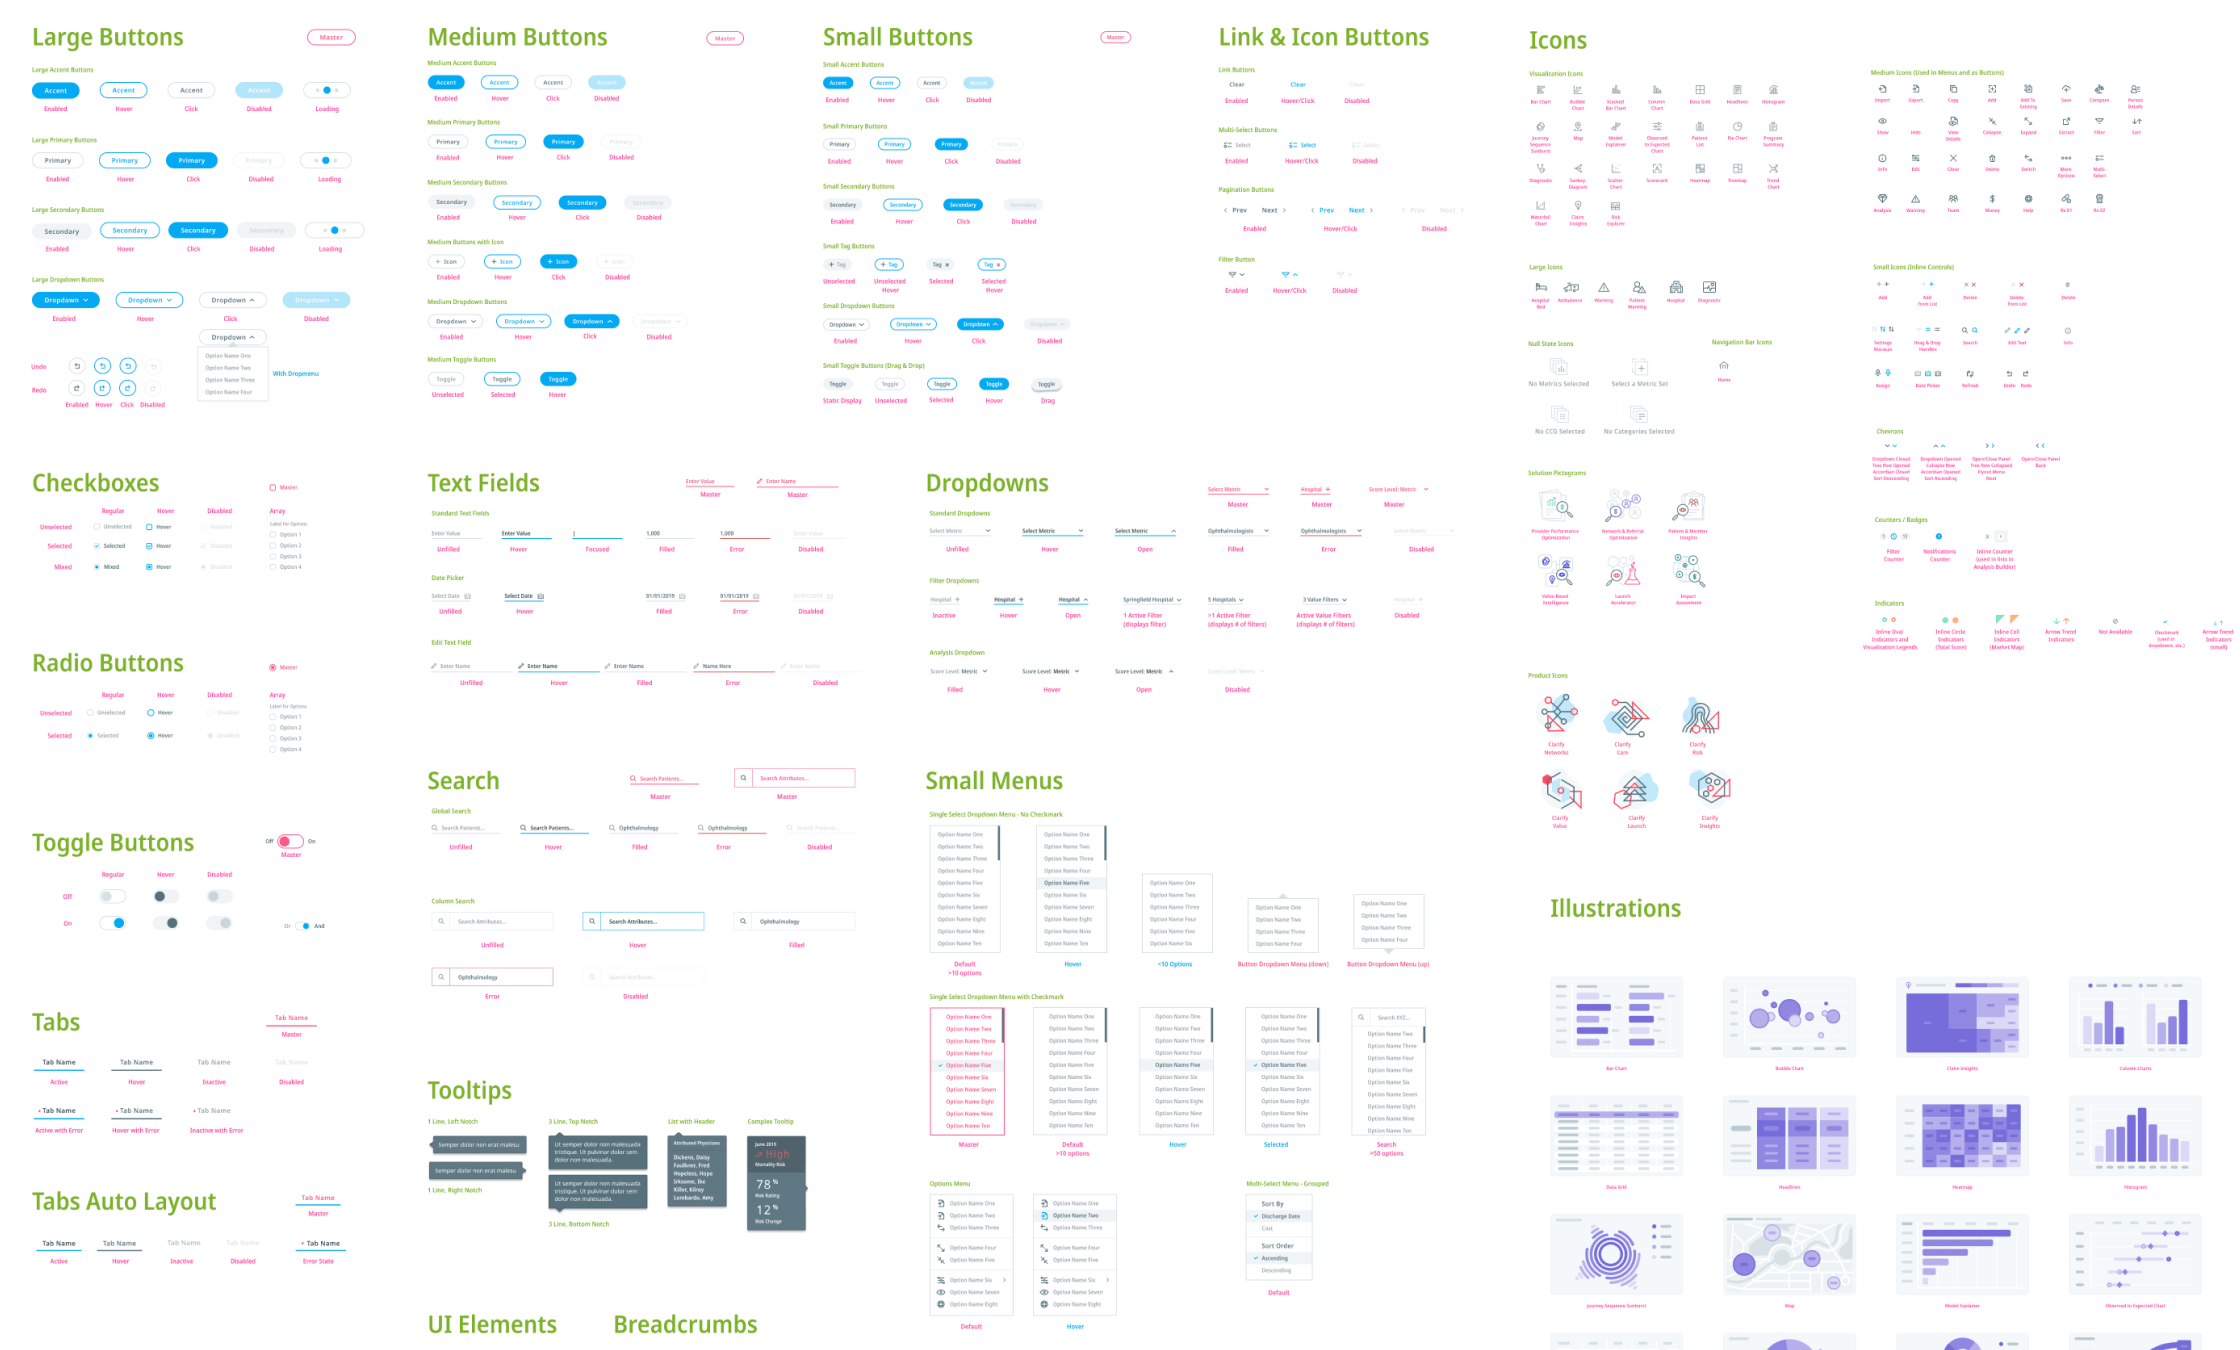
The shared library documents controls, states, icons, menus, and chart patterns used across the products.
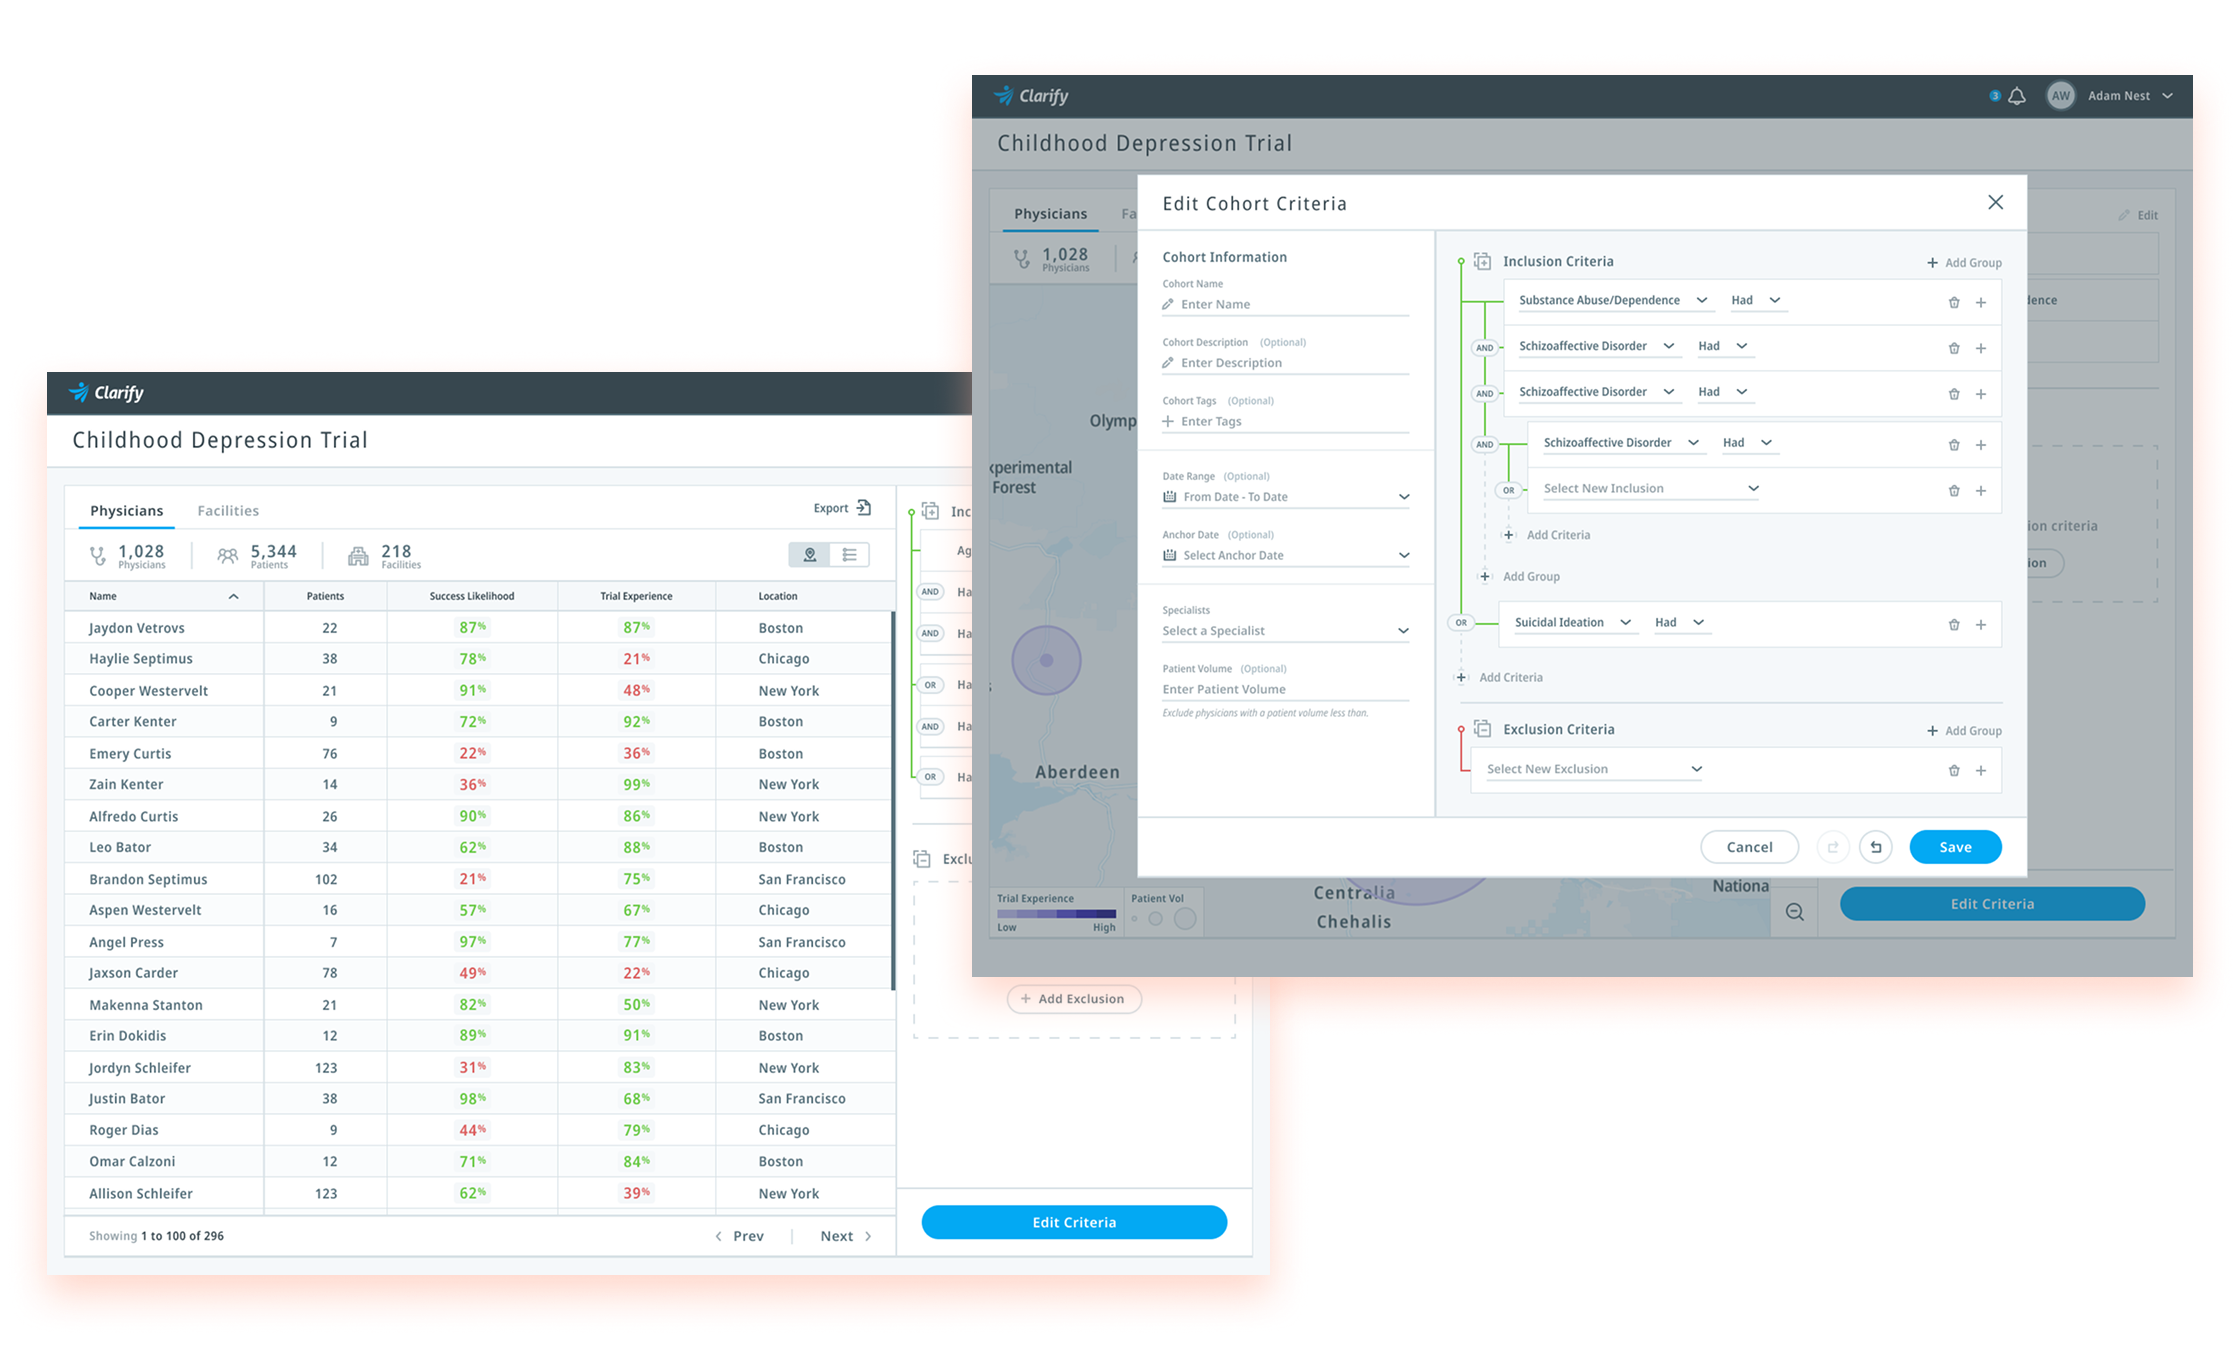
The cohort builder connects a results table with reusable inclusion and exclusion rules.
Product flow
From a map to a defined cohort
Clinical trial teams can explore a geographic area, review physician and facility details, and define the criteria for a cohort within the same workflow.
Results
What changed
Disease Maps
Map exploration, physician and facility detail, and cohort definition became one product workflow.
Designers supporting products
Two designers used a shared system across eight analytics products.
Repeated design and QA
Shared controls, navigation, charts, and states reduced the need to solve the same interface problems separately.
About these results
Interviews and prototype testing informed the product direction. Reductions in repeated design and QA work are qualitative. Customer details are summarized.